
Kasey Nored
Final Project
Consider Graphs of the Equation xy = ax + by +c
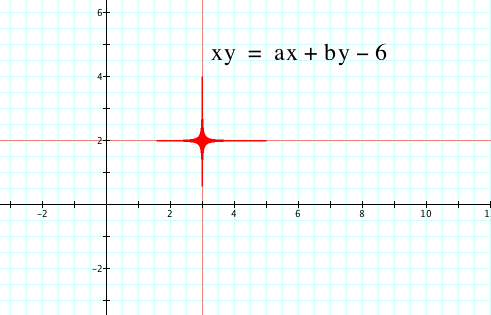
Looking at the above equation if we fix a and b, I choose 2 and 3 respectively and vary c we see some interesting things.
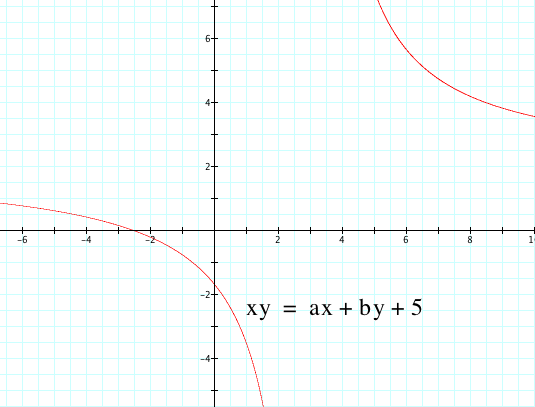
Starting with c = 5 above we have a hyperbola whose center is at 3, 2 showing us that a provides our vertical shift and b provides our horizontal shift. Continuing to manipulate c...
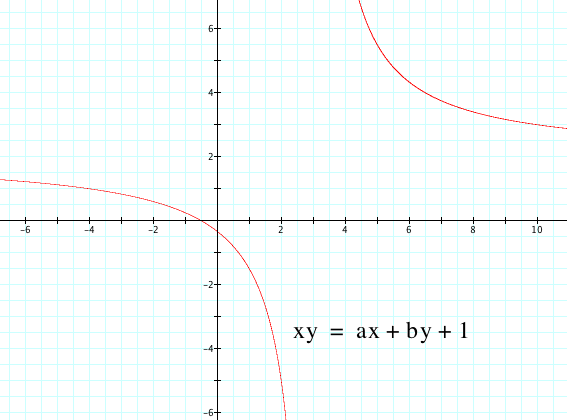
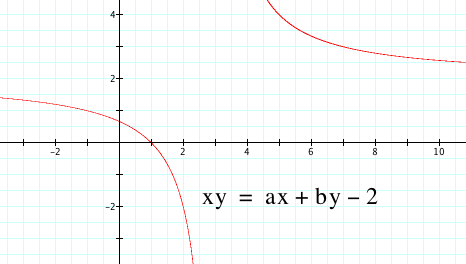
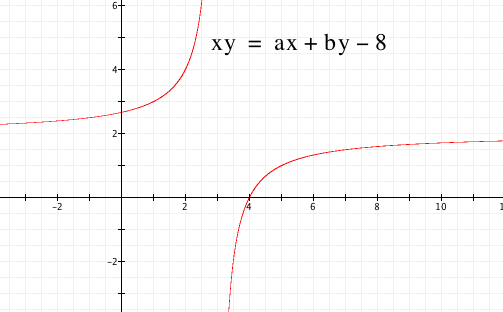
It appears that our hyperbola is approaching our center.
 |
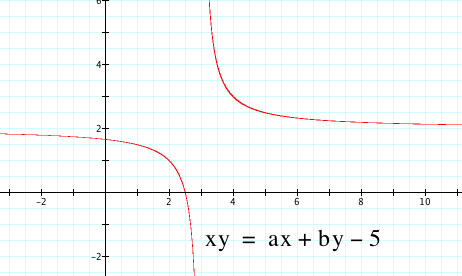 |
And our hyperbola does become two lines.
Interestingly the value of c when our hyperbola becomes two lines is the negative product of a and b.
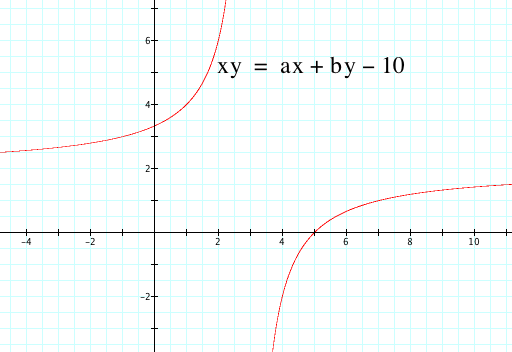
As we continue to vary c, our hyperbola reflects about the asymptotic lines.
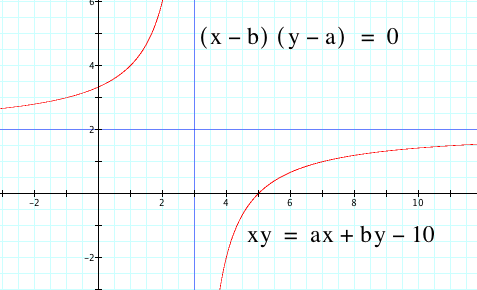
If we want to see the asymptotes of the hyperbola we can graph (x - b) = 0 and (y - a) = 0. Here the asymptotes are graphed with our previous c.
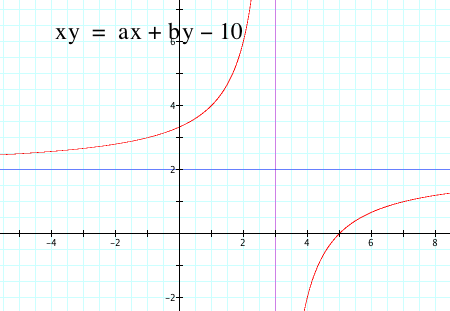
Or, we can graph the asymptotes with one equation (x - b)(y - a) = 0
For further exploration we could look at the graph of (x - b)(y - a) = c
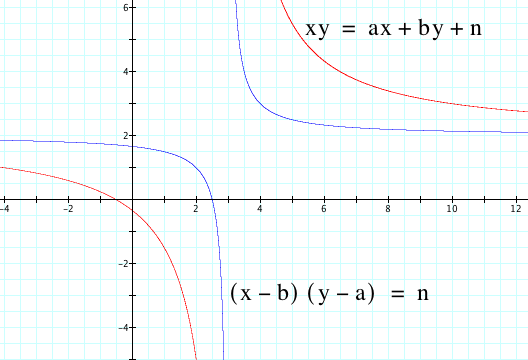
The graph of xy = ax + by + c has asymptotes of x = b and y = a, while the graph of (x - b)(y - a) = n has asymptotes at x = 0 and y = 0.
To look at these graphs while we vary c we have a movie.